🌐 GEFS Ensemble
📆 Forecast verification lead-time picker · all leads vs the same observed hour · valid Fri 8 AM ET
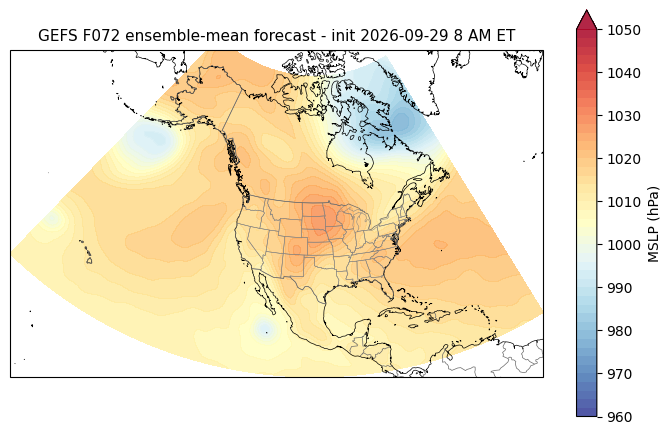
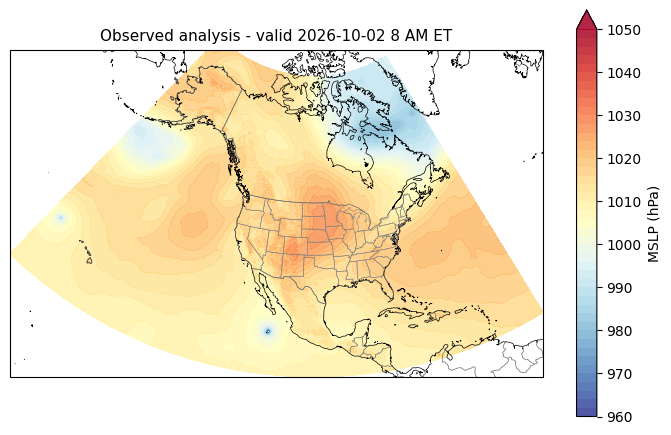
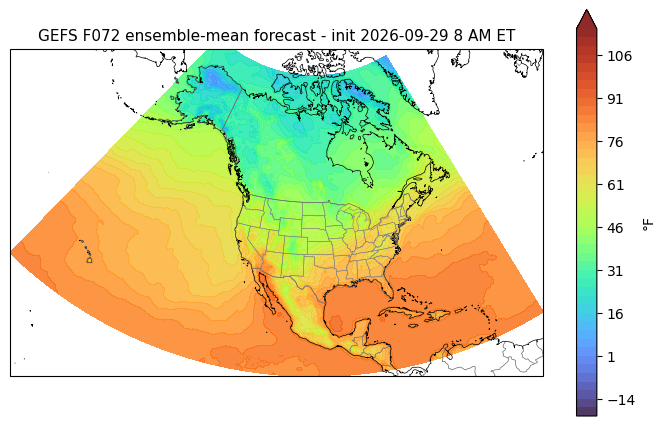
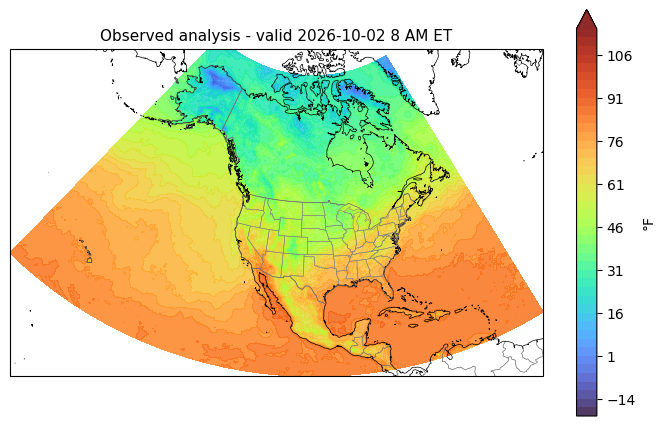
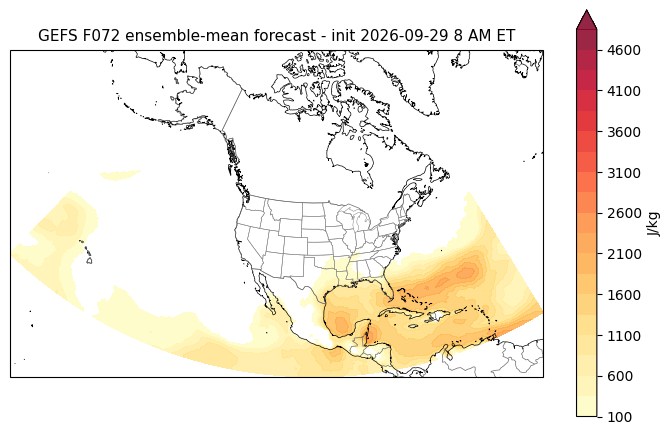
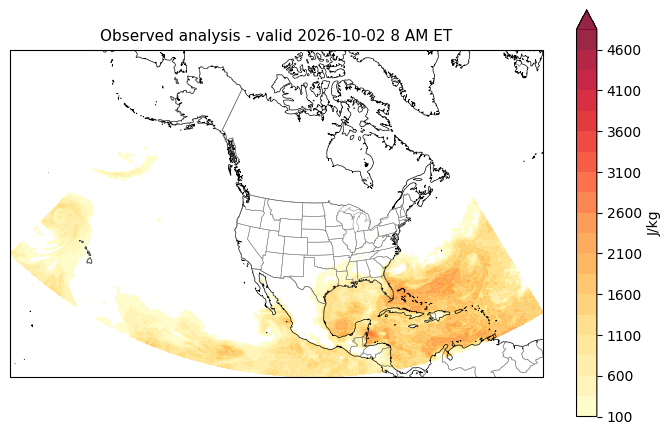
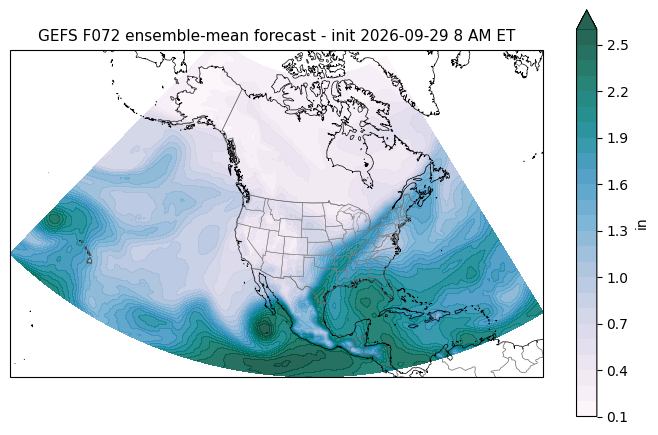
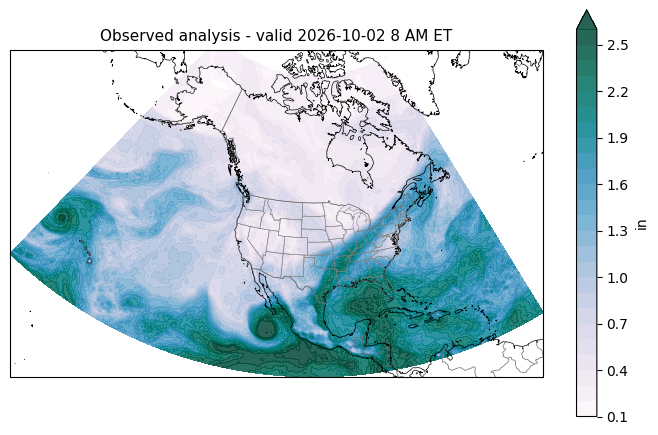
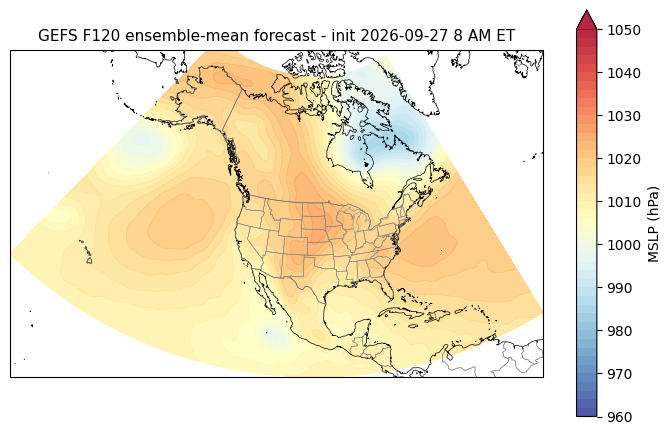
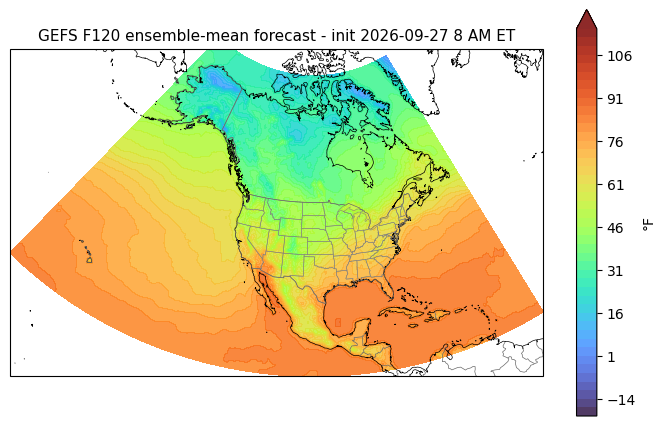
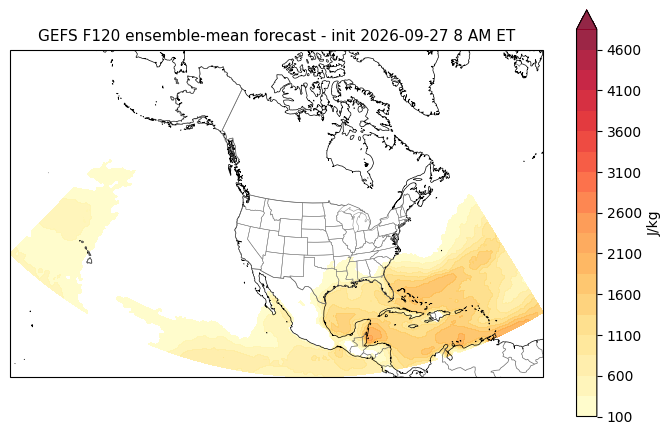
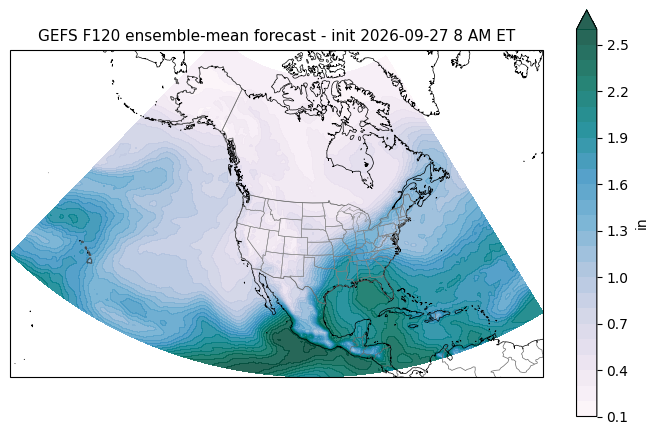
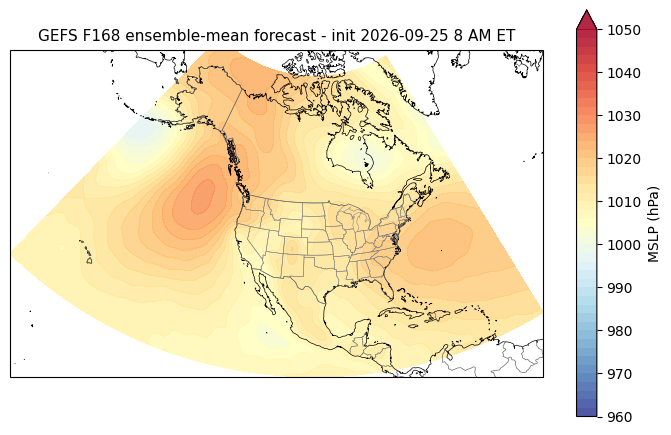
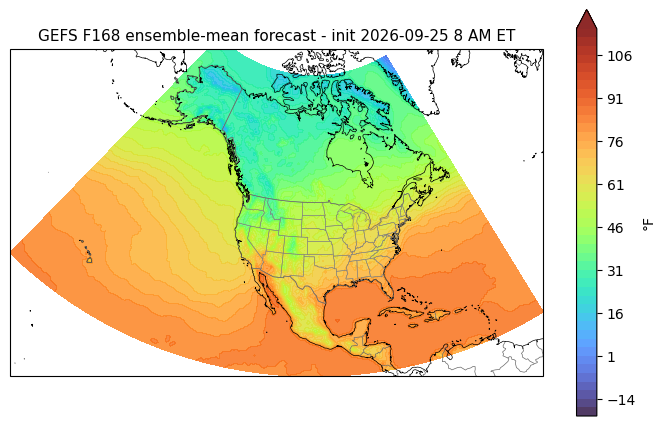
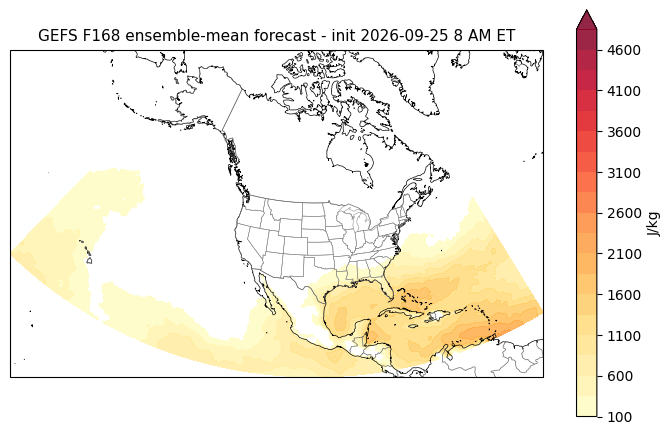
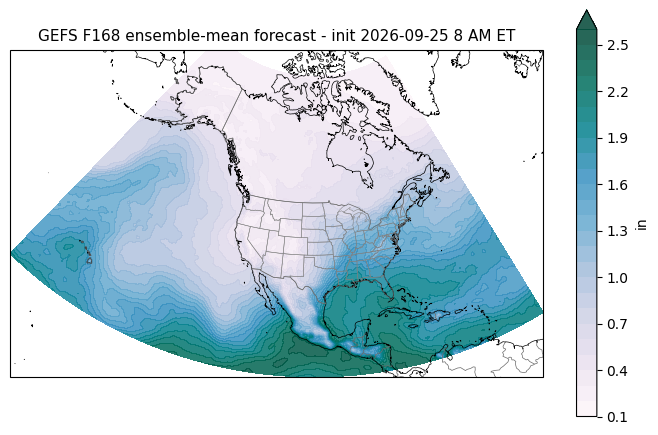
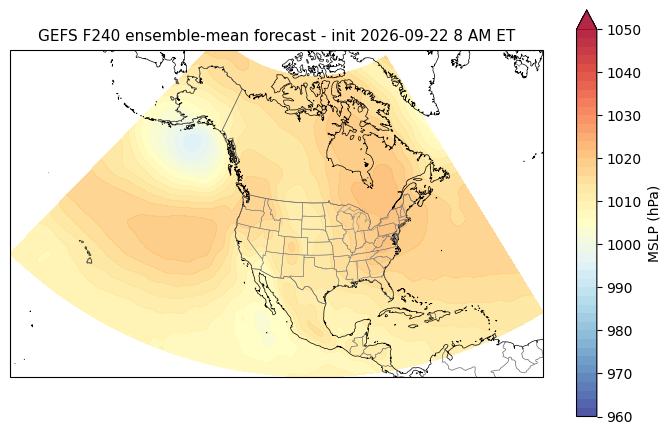
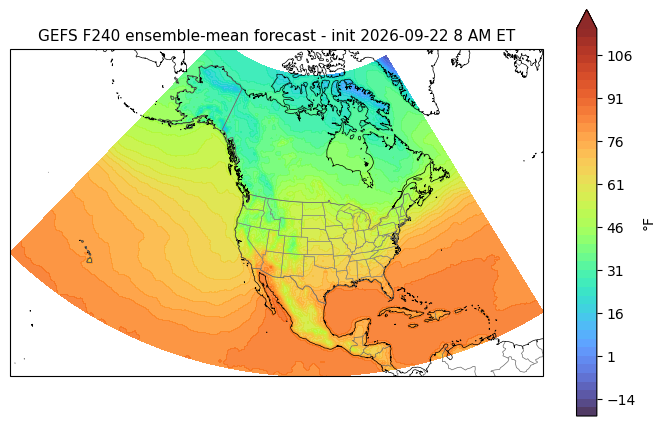
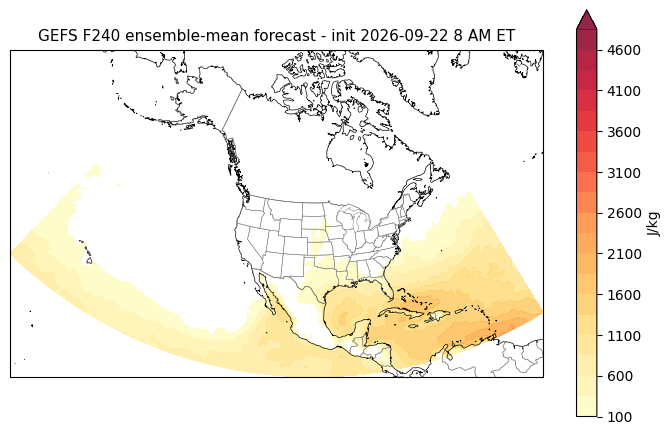
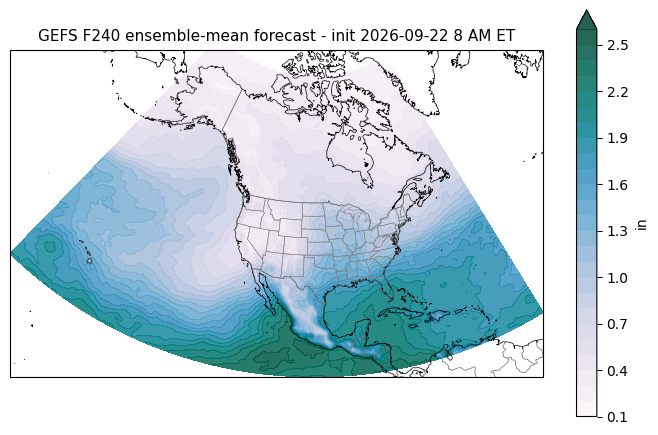
Skill vs lead time - last 90 days (r & ACC)
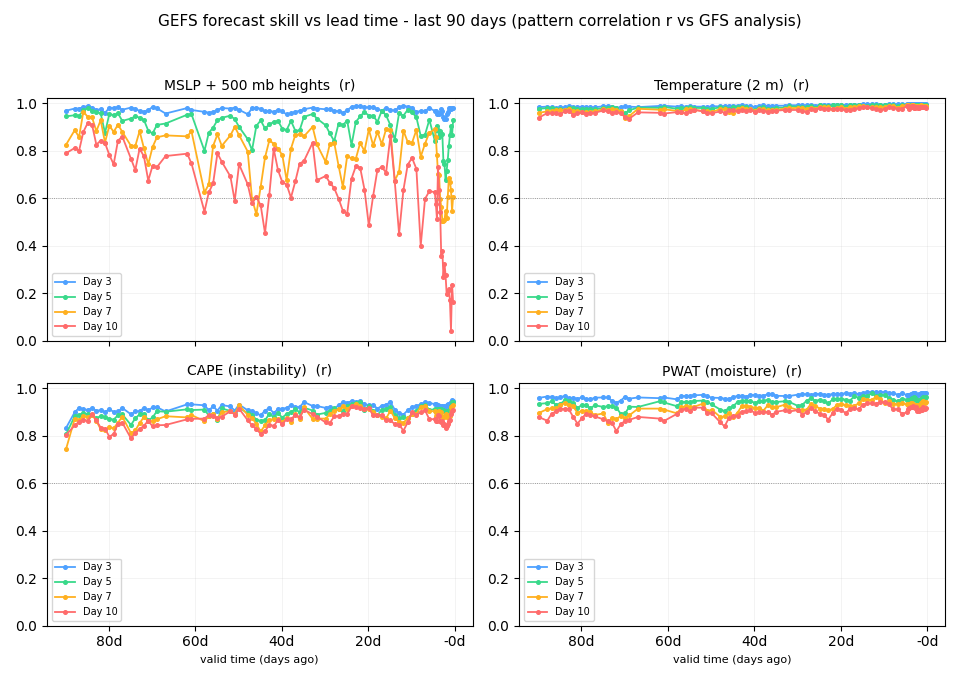
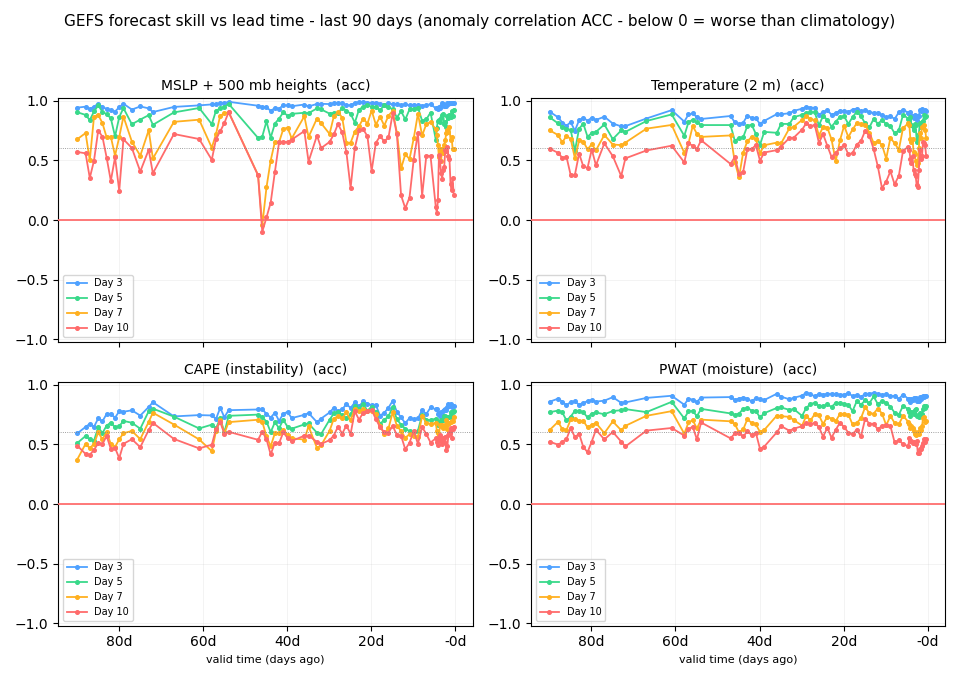 Day 3: r 0.83–1.00 over 90 daysDay 5: r 0.68–0.99 over 90 daysDay 7: r 0.50–0.99 over 90 daysDay 10: r 0.04–0.99 over 90 days
New to forecast verification? Start here
Every forecast is easy to check in hindsight - this card does it with numbers. The idea: take a real forecast from 3, 5, 7, or 10 days out (kept in NOAA's archive), wait for the weather to happen, then compare the two maps and score them. A score near the top means the forecast put the right weather in the right place.
| Score | Plain-English question it answers | Good |
|---|---|---|
| RMS | On average, how far off was the number? (hPa, degrees, ...) | lower is better |
| r | Do the map's highs and lows line up with what happened? | 1 = perfect |
| ACC | Did it beat just predicting "normal weather for the date"? (vs a 5-year climatology) | above 0; below 0 = worse than climatology |
| S/S | Did the 31 members disagree as much as the forecast turned out to be wrong? (their spread vs the actual error) | near 1.0; <1 = overconfident |
| bias | Did it systematically run too warm/wet (+) or too cool/dry (−)? | near 0 |
Rules of thumb from our own 77-day record (MSLP): day-3 forecasts are near-perfect (ACC 0.96); day-5 are good (0.88); day-7 are useful but rougher (0.72); day-10 average 0.55 - and in our record they dipped below 0 once, meaning on that day flipping a coin with climatology would have done better. Temperature holds up much better than rain-based fields at long range: pattern errors grow fastest in CAPE and PWAT, so trust a day-10 temperature outlook more than a day-10 storm forecast.
How to read a pair of maps: start with the forecast (left/top image), form a picture - where is the low, where is the warm tongue - then look at the observed map and ask what moved. Then check the badge: high ACC but visible differences means the big picture was right and details moved; ACC near 0 means the whole pattern was wrong. The S/S number tells you whether the ensemble was honestly uncertain about it.
Both chart panels show these scores for every valid day of the last ~3 months, one colored line per lead: the vertical gap between lines is skill lost with lead time; the red 0-line on the ACC chart is the bust line. Data: NOAA GEFS + GFS, no keys. Scores are computed nightly by this site from the public archive.