❄️ Winter Weather
HRRR snow & ice forecast maps · WPC Winter Weather Desk · CPC 2026-27 seasonal outlooks · winter alerts - updated 2026-10-02 5:51 PM ET
Nationwide winter alertsNo active winter alerts nationwide right now
HRRR cycle2026-10-02 4 PM ET
0.1-1"
1-2"
2-4"
4-6"
6-12"
12"+
ice 0.1-0.25"
ice 0.25"+
HRRR 2026-10-02 4 PM ET - accumulated snowfall (ASNOW) and freezing rain (FROZR) through each window, decoded from NOAA's open-data bucket and rendered here. On warm days the maps are honestly empty; the first cold storm paints them automatically.
🌨️ Model snowfall forecasts - every model with a snow field
Same maps the Models tab renders, overlaid on the winter map: GFS (day 1-10 accumulated snowfall), GEFS ensemble mean + spread (spread = where runs disagree - wide spread means low forecast confidence), and the NBM 6-hour blend. Tick Model snowfall, pick a model and hour. The rotation keeps these current every model cycle; hours appear as they render.
⚠️ Winter alerts
Tennessee0 alert(s)
No winter alerts for Tennessee - exactly what a quiet day looks like.
🗺️ WPC Winter Weather Desk (national)
Weather Prediction Center winter desks run twice daily in the cold season; probabilities are for at least the amount shown through each day.
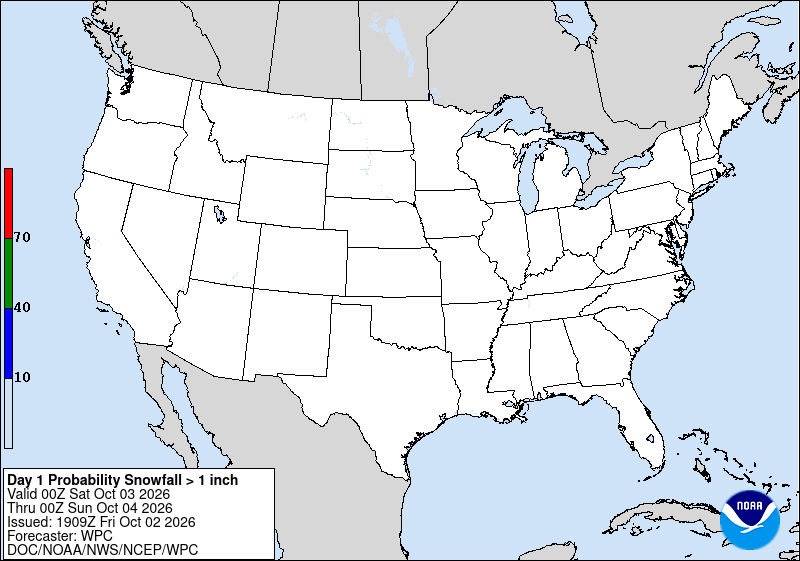 Day 1 snow > 1 in
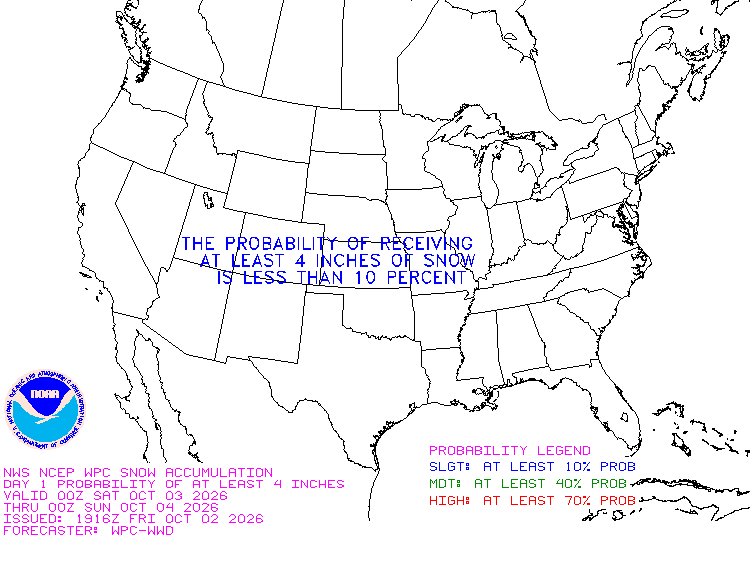 Day 1 snow > 4 in
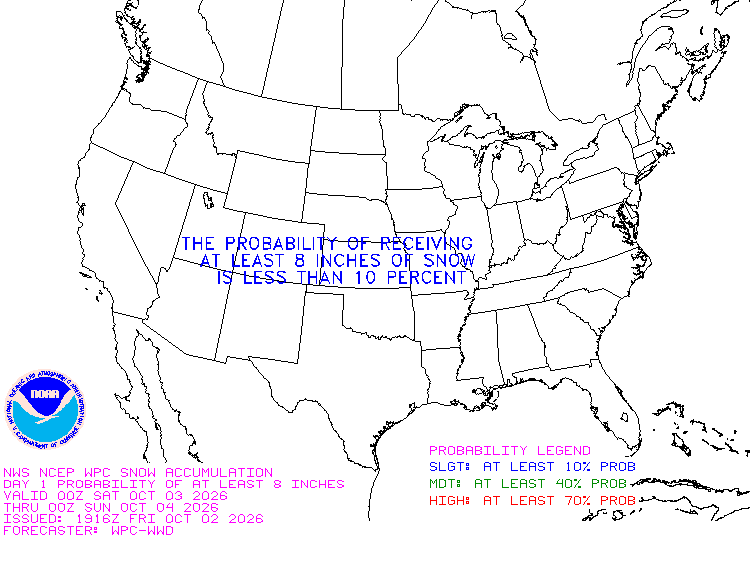 Day 1 snow > 8 in
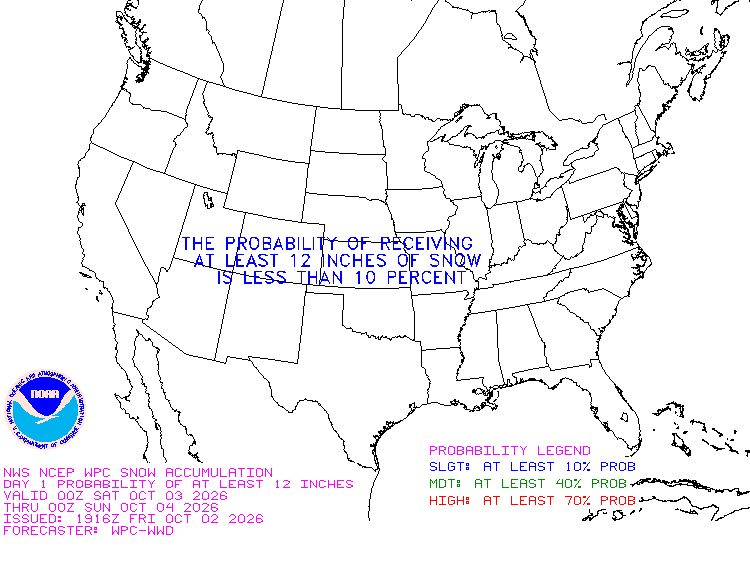 Day 1 snow > 12 in
 Day 1 ice > 0.25 in
 Day 1 winter composite
 Day 2 snow > 1 in
 Day 2 snow > 4 in
 Day 2 snow > 8 in
 Day 2 ice > 0.25 in
 Day 2 winter composite
 Day 3 snow > 1 in
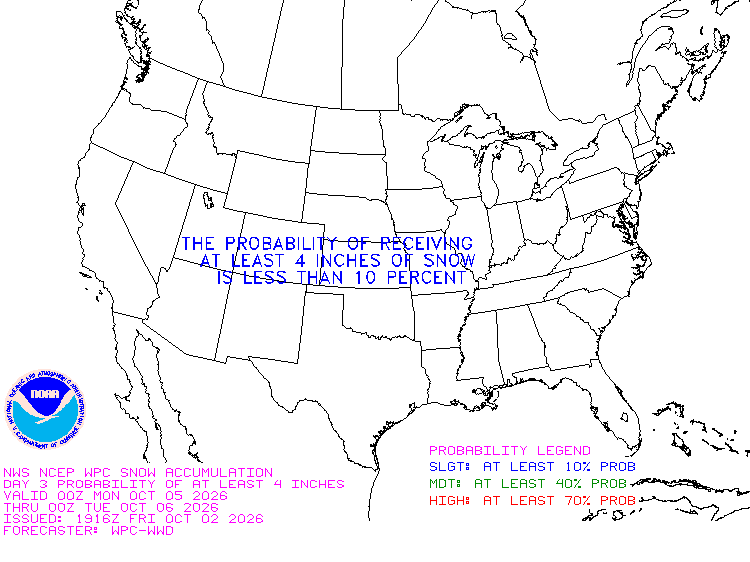 Day 3 snow > 4 in
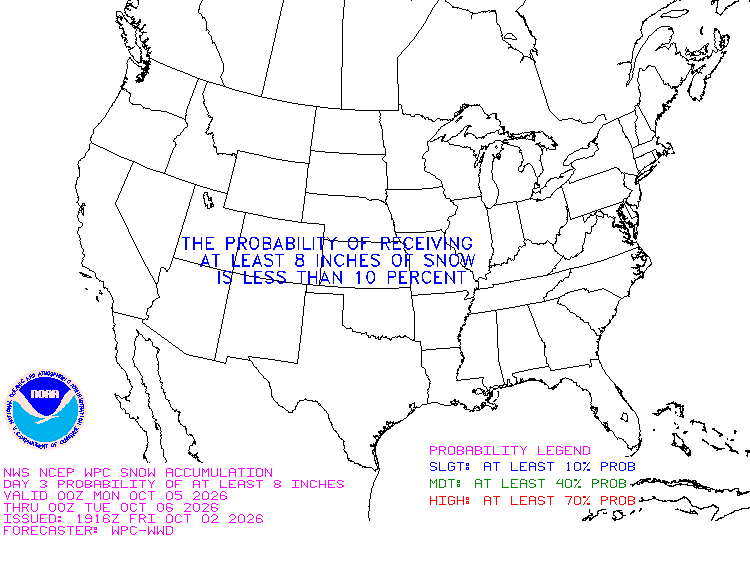 Day 3 snow > 8 in
 Day 3 winter composite
 Winter storm low tracks
🌐 Winter 2026-27 seasonal outlooks (CPC long-lead)
Climate Prediction Center seasonal outlooks - the official NOAA winter forecast for 2026-27. Each 3-month window is a probability tilt, not an amount: blues = below normal, reds = above, gray = equal chances (no signal). The three rows shift one month deeper into winter - updated the third Thursday of each month. A cold-blue column over Tennessee with a wet-green precipitation row is the classic big-winter setup; a warm-red column says expect another flip-flop season.
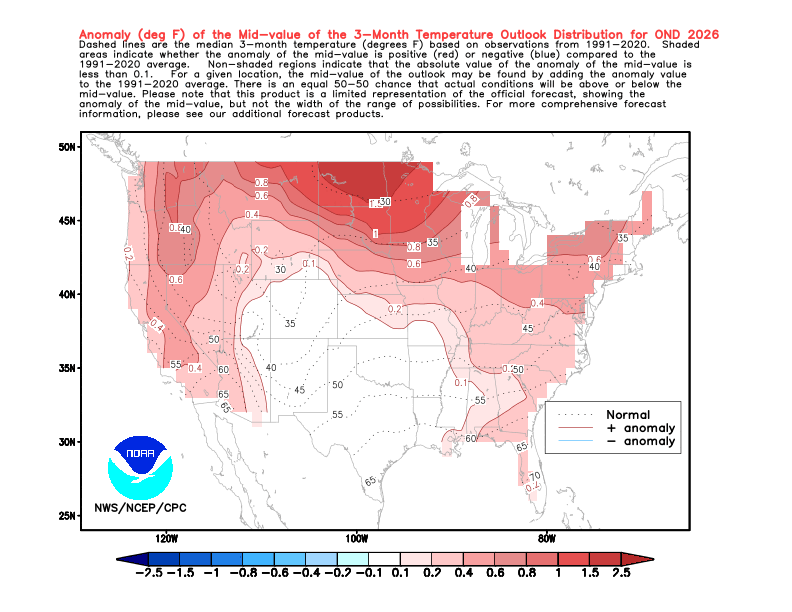 Seasonal temperature outlook - newest window (blue below / red above)
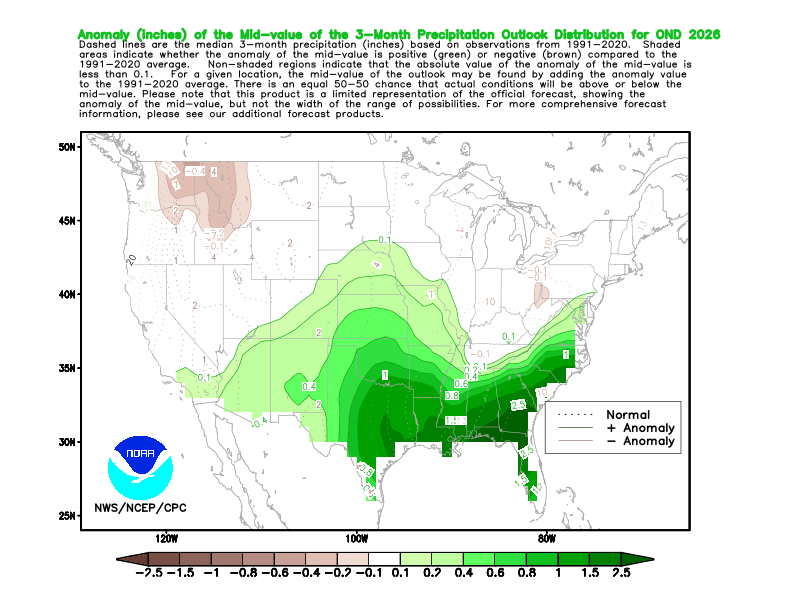 Seasonal precipitation outlook - newest window
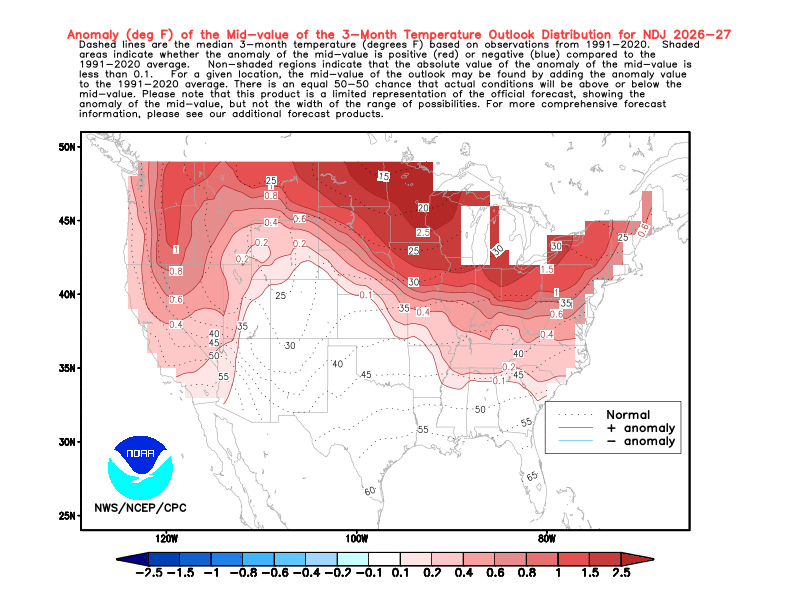 Seasonal temperature outlook - window +1 month
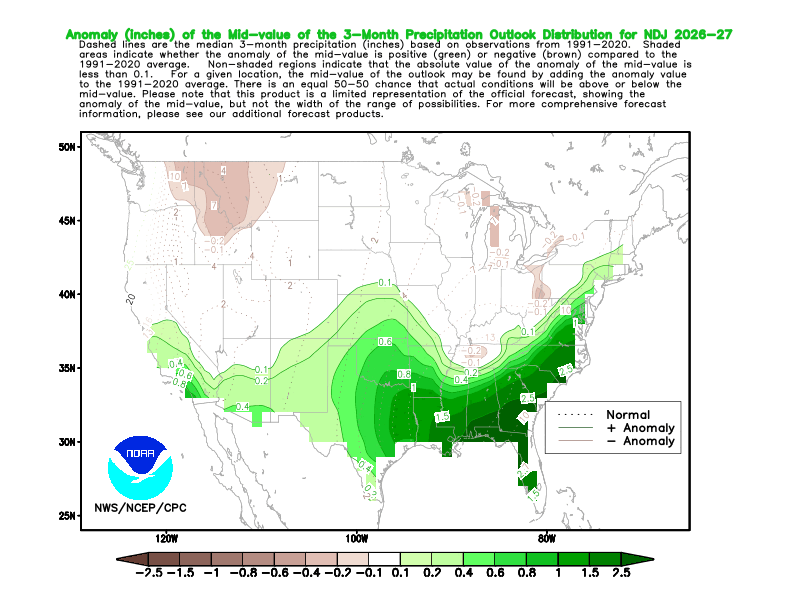 Seasonal precipitation outlook - window +1 month
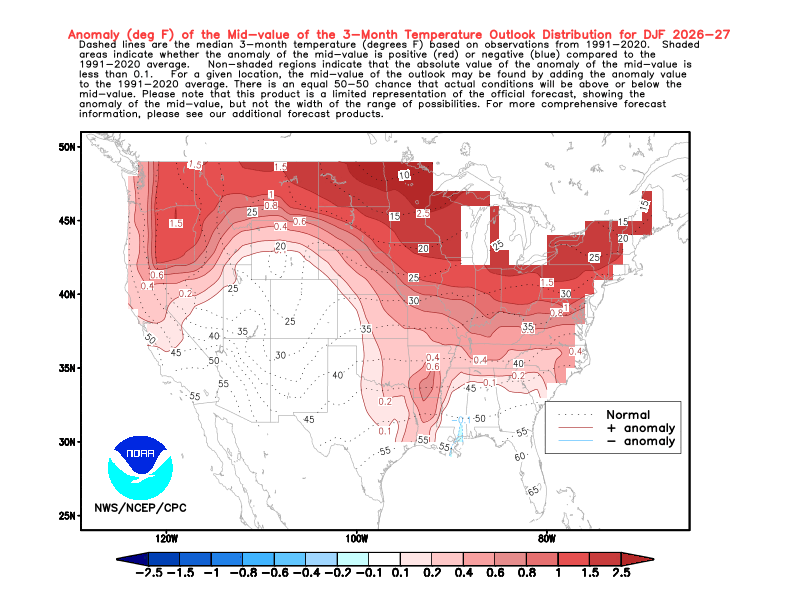 Seasonal temperature outlook - window +2 months
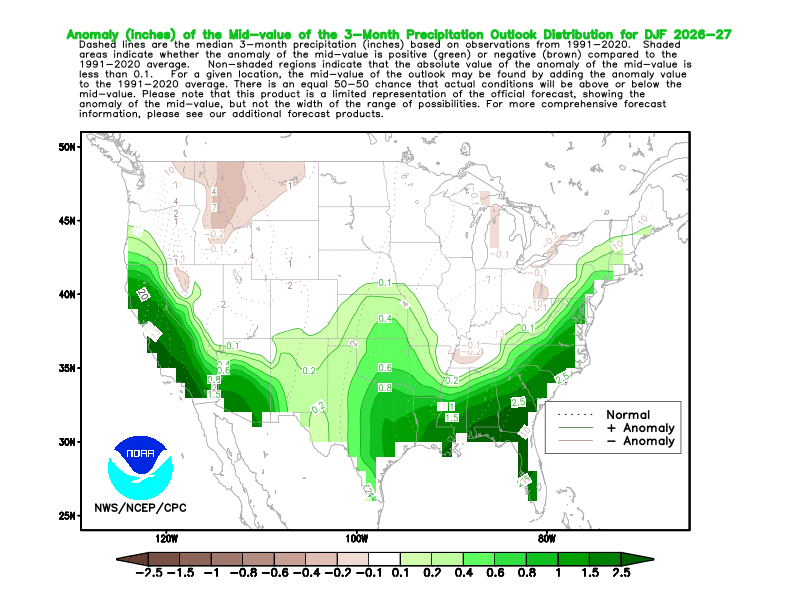 Seasonal precipitation outlook - window +2 months
❄️ CPC seasonal snowfall chance - interactive tilt map
The SAME Climate Prediction Center 2026-27 outlook as the image gallery below, drawn as the actual forecast contours: red = warmer than normal, blue = colder, green = wetter, tan = drier. Snow chance is where a cold tilt overlaps a wet tilt. Toggle layers, drag the map, tap a contour for its probability.
Issued2026-09-17
Snow-chance peak-
warmer
colder
wetter
drier
snow 42-49%
50-59%
60%+
Compare with the short range - CPC's 6-10 and 8-14 day outlooks on the same map. Same color language as the seasonal layers: blues = below-normal, browns = above-normal temperature, greens = wetter, tans = drier. Line styles tell the forecast range apart: solid = seasonal tilts, coarse dashes = seasonal snow chance, fine dots = the 6-14 day short range.
Nov-Dec-Jan (NDJ)
No snow-chance overlap this window - the CPC temperature outlook has no below-normal contours, so the cold+wet intersection is empty. That is the honest read of a warm-tilt winter.
US Northeast
40% chance of a warmer-than-normal window
warm 40% · cold 0% · wet 0% · dry 0%
US Midwest
40% chance of a warmer-than-normal window
warm 40% · cold 0% · wet 0% · dry 0%
Tennessee
Near-normal temperatures and precipitation (equal chances)
warm 0% · cold 0% · wet 0% · dry 0%
East Tennessee
Near-normal temperatures and precipitation (equal chances)
warm 0% · cold 0% · wet 0% · dry 0%
LIGHT Warm-tilt winter: snowfall chances suppressed; watch for cold snaps in the 6-10 day outlooks
Dec-Jan-Feb (DJF)
No snow-chance overlap this window - the CPC temperature outlook has no below-normal contours, so the cold+wet intersection is empty. That is the honest read of a warm-tilt winter.
US Northeast
50% chance of a warmer-than-normal window
warm 50% · cold 0% · wet 0% · dry 0%
US Midwest
40% chance of a warmer-than-normal window
warm 40% · cold 0% · wet 0% · dry 0%
Tennessee
Near-normal temperatures and precipitation (equal chances)
warm 0% · cold 0% · wet 0% · dry 0%
East Tennessee
Near-normal temperatures and precipitation (equal chances)
warm 0% · cold 0% · wet 0% · dry 0%
LIGHT Warm-tilt winter: snowfall chances suppressed; watch for cold snaps in the 6-10 day outlooks
Jan-Feb-Mar (JFM)
No snow-chance overlap this window - the CPC temperature outlook has no below-normal contours, so the cold+wet intersection is empty. That is the honest read of a warm-tilt winter.
US Northeast
50% chance of a warmer-than-normal window
warm 50% · cold 0% · wet 0% · dry 0%
US Midwest
40% chance of a warmer-than-normal window
warm 40% · cold 0% · wet 0% · dry 0%
Tennessee
Near-normal temperatures and precipitation (equal chances)
warm 0% · cold 0% · wet 0% · dry 0%
East Tennessee
Near-normal temperatures and precipitation (equal chances)
warm 0% · cold 0% · wet 0% · dry 0%
LIGHT Warm-tilt winter: snowfall chances suppressed; watch for cold snaps in the 6-10 day outlooks
📖 Winter almanac - what a normal winter looks like here
The climatological baselines behind the forecasts above: NOAA's 1991-2020 U.S. Climate Normals and period-of-record storm records for East Tennessee's four anchor stations. "First/last freeze" is the median date the temperature first/last drops to 32°F; "biggest storm" is the largest single-storm snowfall on record at the station.
| Station | Avg seasonal snowfall | First freeze (median) | Last freeze (median) | Biggest single storm |
|---|---|---|---|---|
| Knoxville (TYS, since 1871) | 4.6" | Nov 2 | Apr 1 | 17.5" - Feb 13, 1960 |
| Chattanooga (CHA, since 1879) | 3.6" | Nov 9 | Mar 24 | 18.5" - Mar 13, 1993 (Superstorm) |
| Tri-Cities (TRI, since 1937) | 9.2" | Oct 24 | Apr 16 | 16.2" - Nov 21, 1952 |
| Crossville (CSV, Cumberland Plateau, ~1,860 ft) | ~6-7" (station reports spotty; derived from daily sums) | Oct 23 | Apr 12 | 18.0" - Mar 13, 1993 (Superstorm) |
Read it like an East Tennessean: the Plateau and Tri-Cities run 2-3 weeks ahead of Knoxville and Chattanooga into winter and a week behind coming out - freeze is a daily occurrence up there by late October. And the Superstorm of March 1993 appearing in two rows of the same table is no coincidence: the biggest storm in most of Tennessee's recorded history did not care about elevation. The row inside its current first-freeze window is highlighted. Sources: NWS Morristown climate pages (weather.gov/mrx: Knoxville, Chattanooga, Tri-Cities normals & records) and NOAA's ACIS climate database (Crossville daily records); normals period 1991-2020.
🌨️ Season-to-date snow tracker - observed vs. the outlook
Every observed snow event (0.1"+) this snow year at the four anchor stations, logged from NOAA's ACIS daily database - then checked against the pace each station's CPC seasonal outlook implies. "Expected by now" applies the normal seasonal shape (quiet Oct/Nov, ramping Dec, peaking Jan) to the station's 1991-2020 normal: if the observed total tracks that curve, the outlook is verifying; if not, the panel says so plainly. Before Oct 1 the panel shows the most recent complete season as its proving ground.
Loading the season-to-date record…
Source: NOAA ACIS daily database (data.rcc-acis.org) - the same records behind the almanac above; normals 1991-2020. Event grouping: consecutive snowy days count as one storm (a single dry day between them does not split it).
📅 Weeks 2-4: CPC extended outlooks
Climate Prediction Center 6-10 and 8-14 day outlooks - the standard extended-range winter guidance. Below-normal temperatures (blues) + a wet signal = the pattern that produces Tennessee Valley snow.
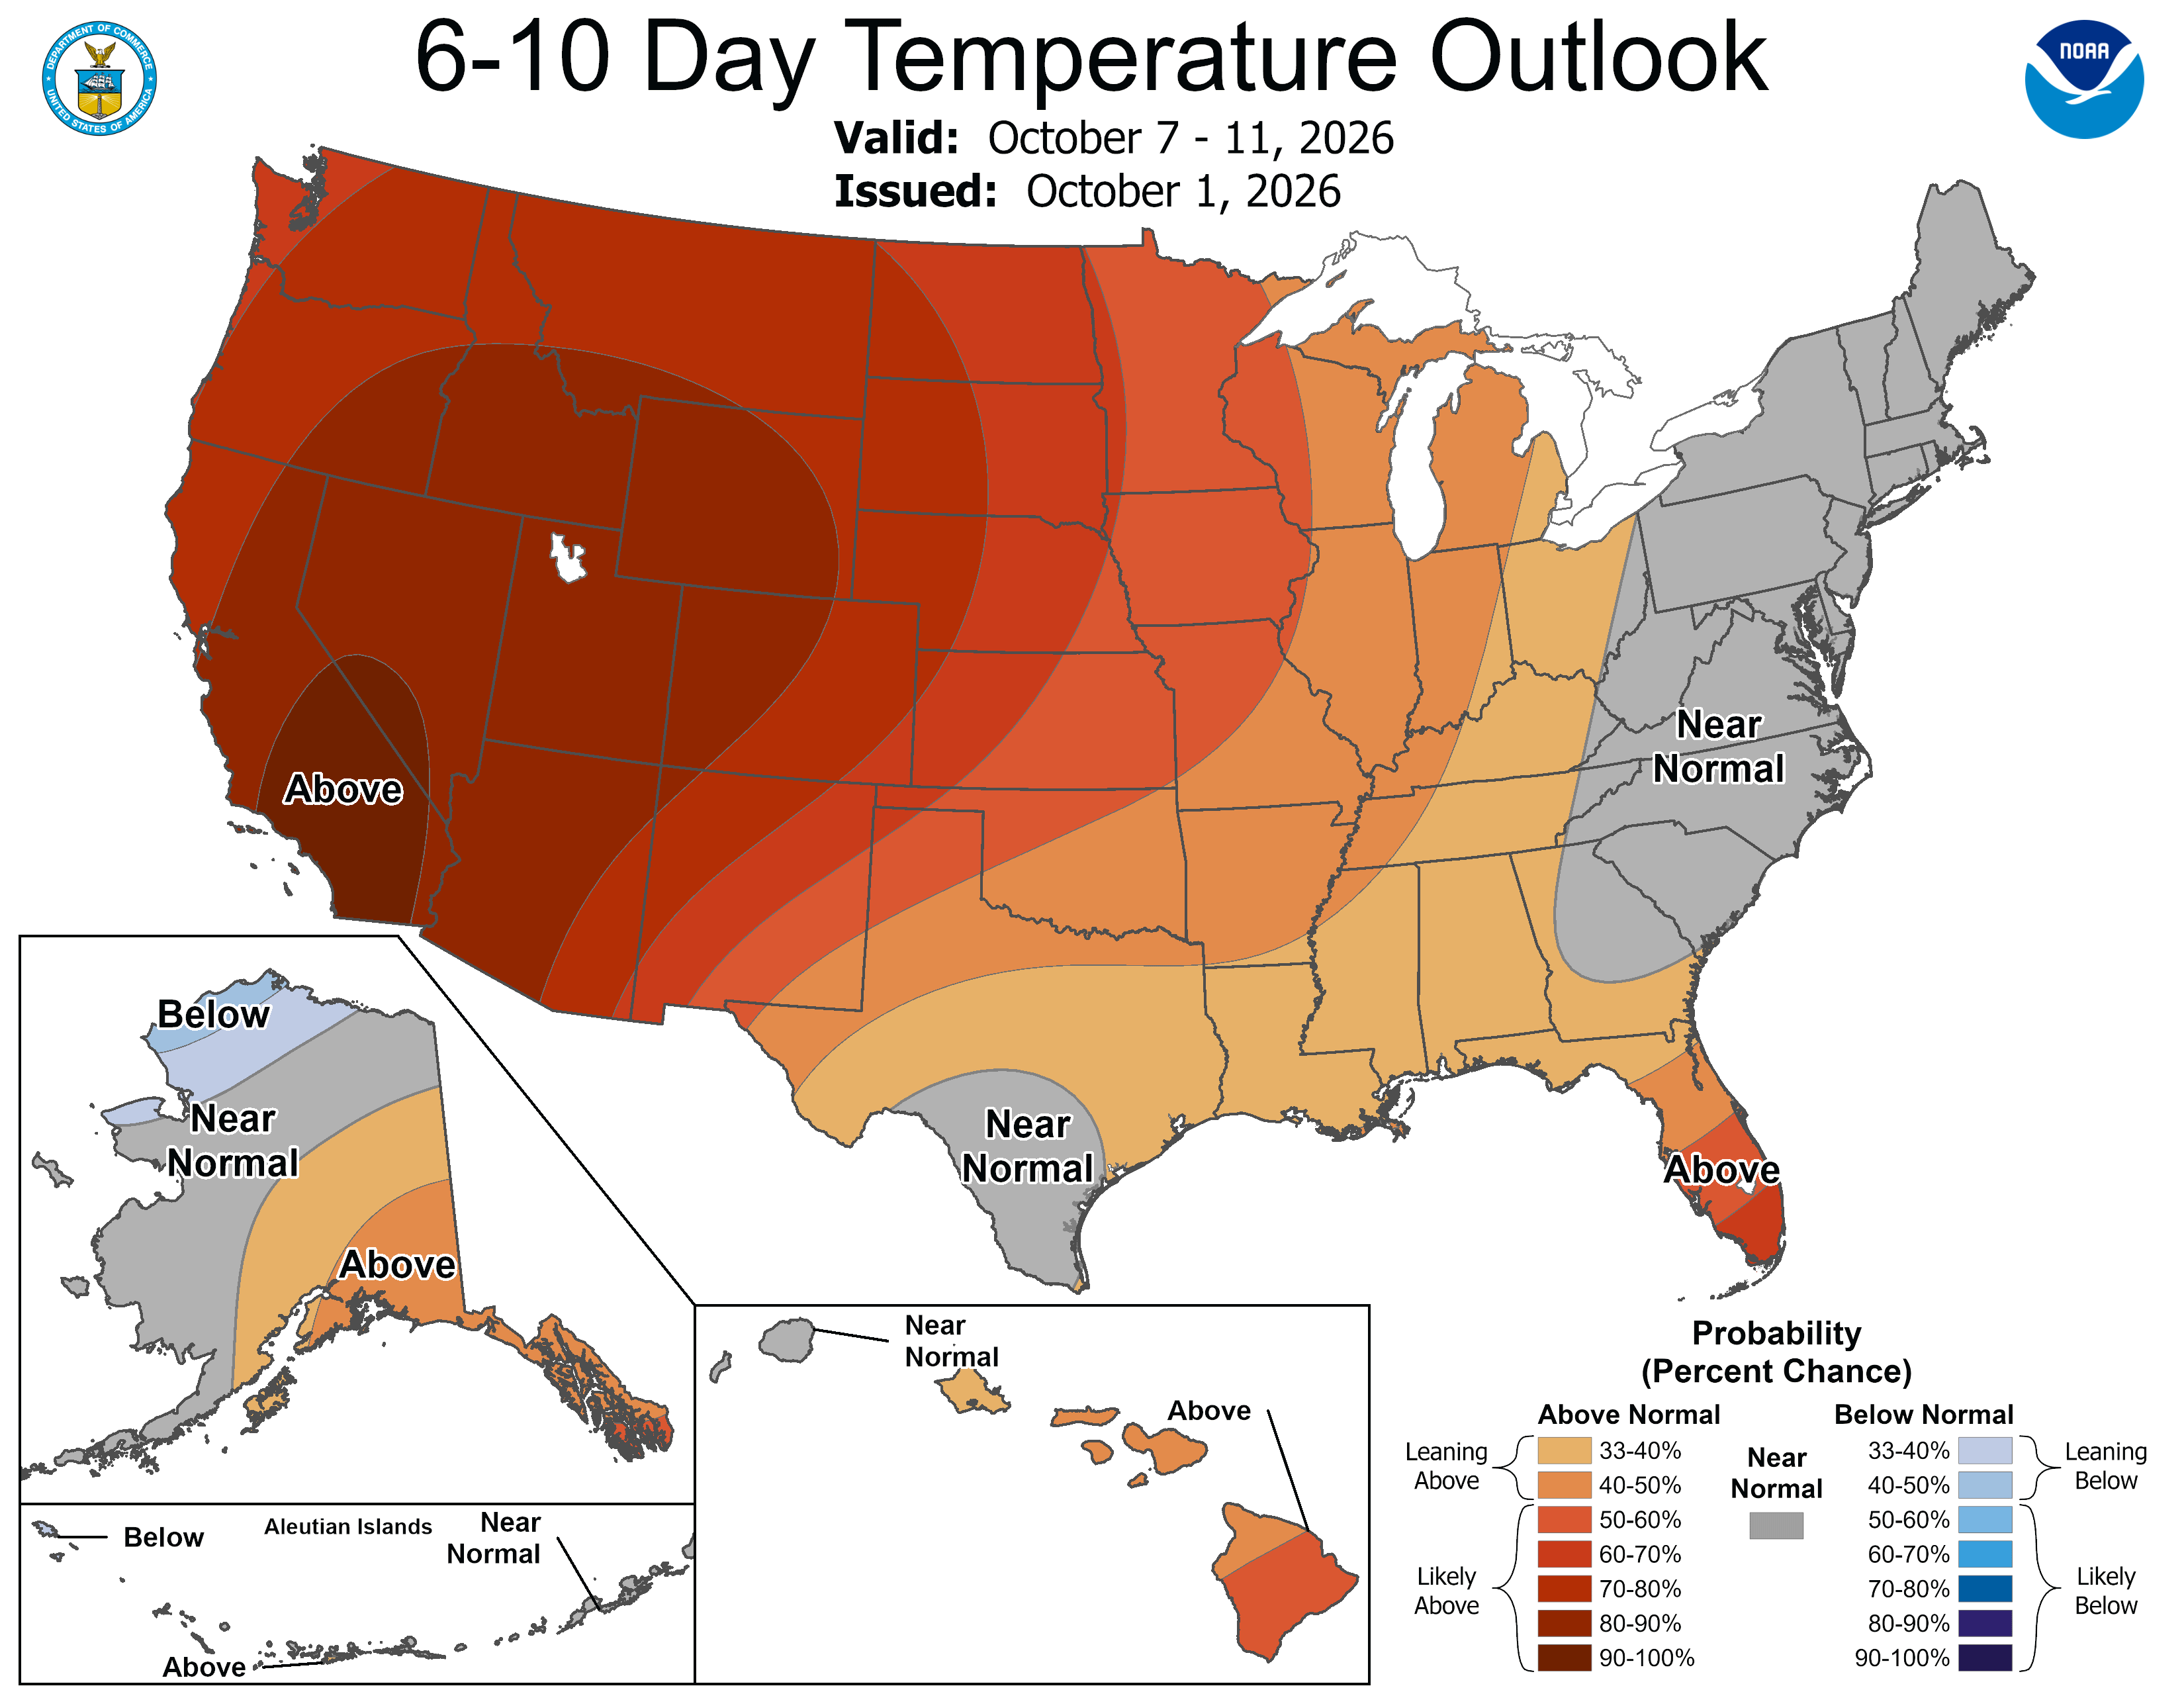 6-10 day temperature outlook
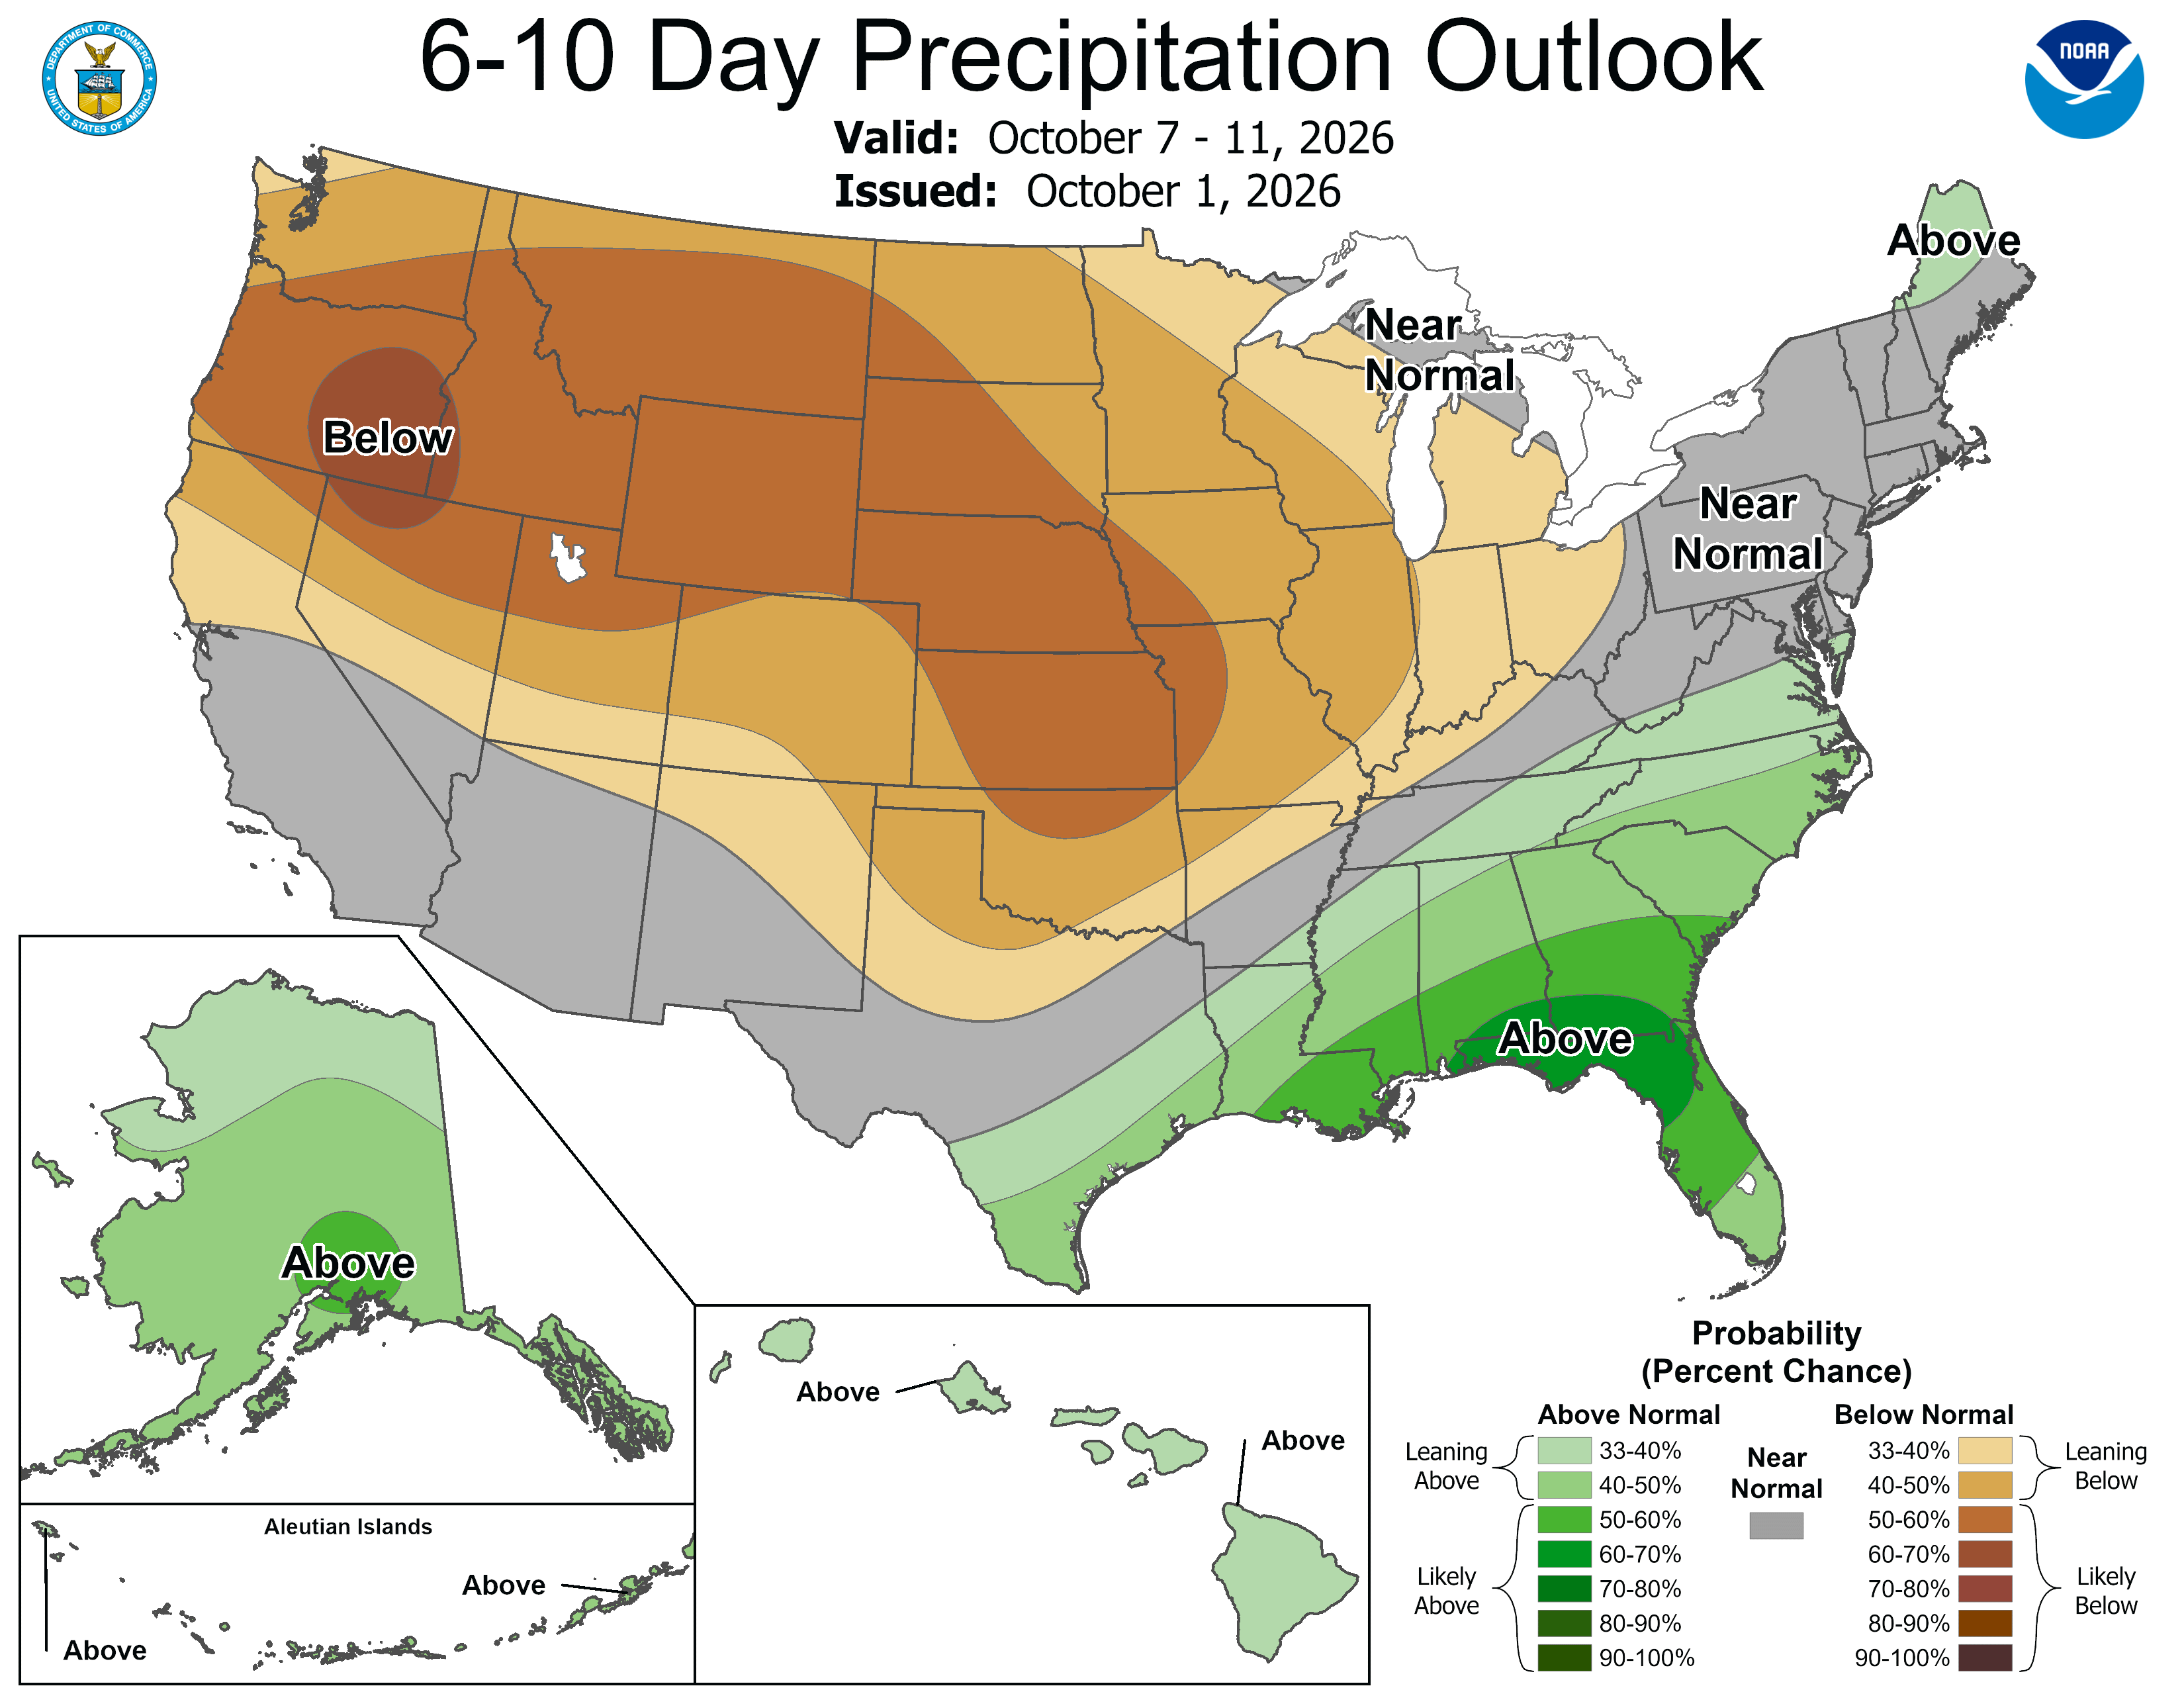 6-10 day precipitation outlook
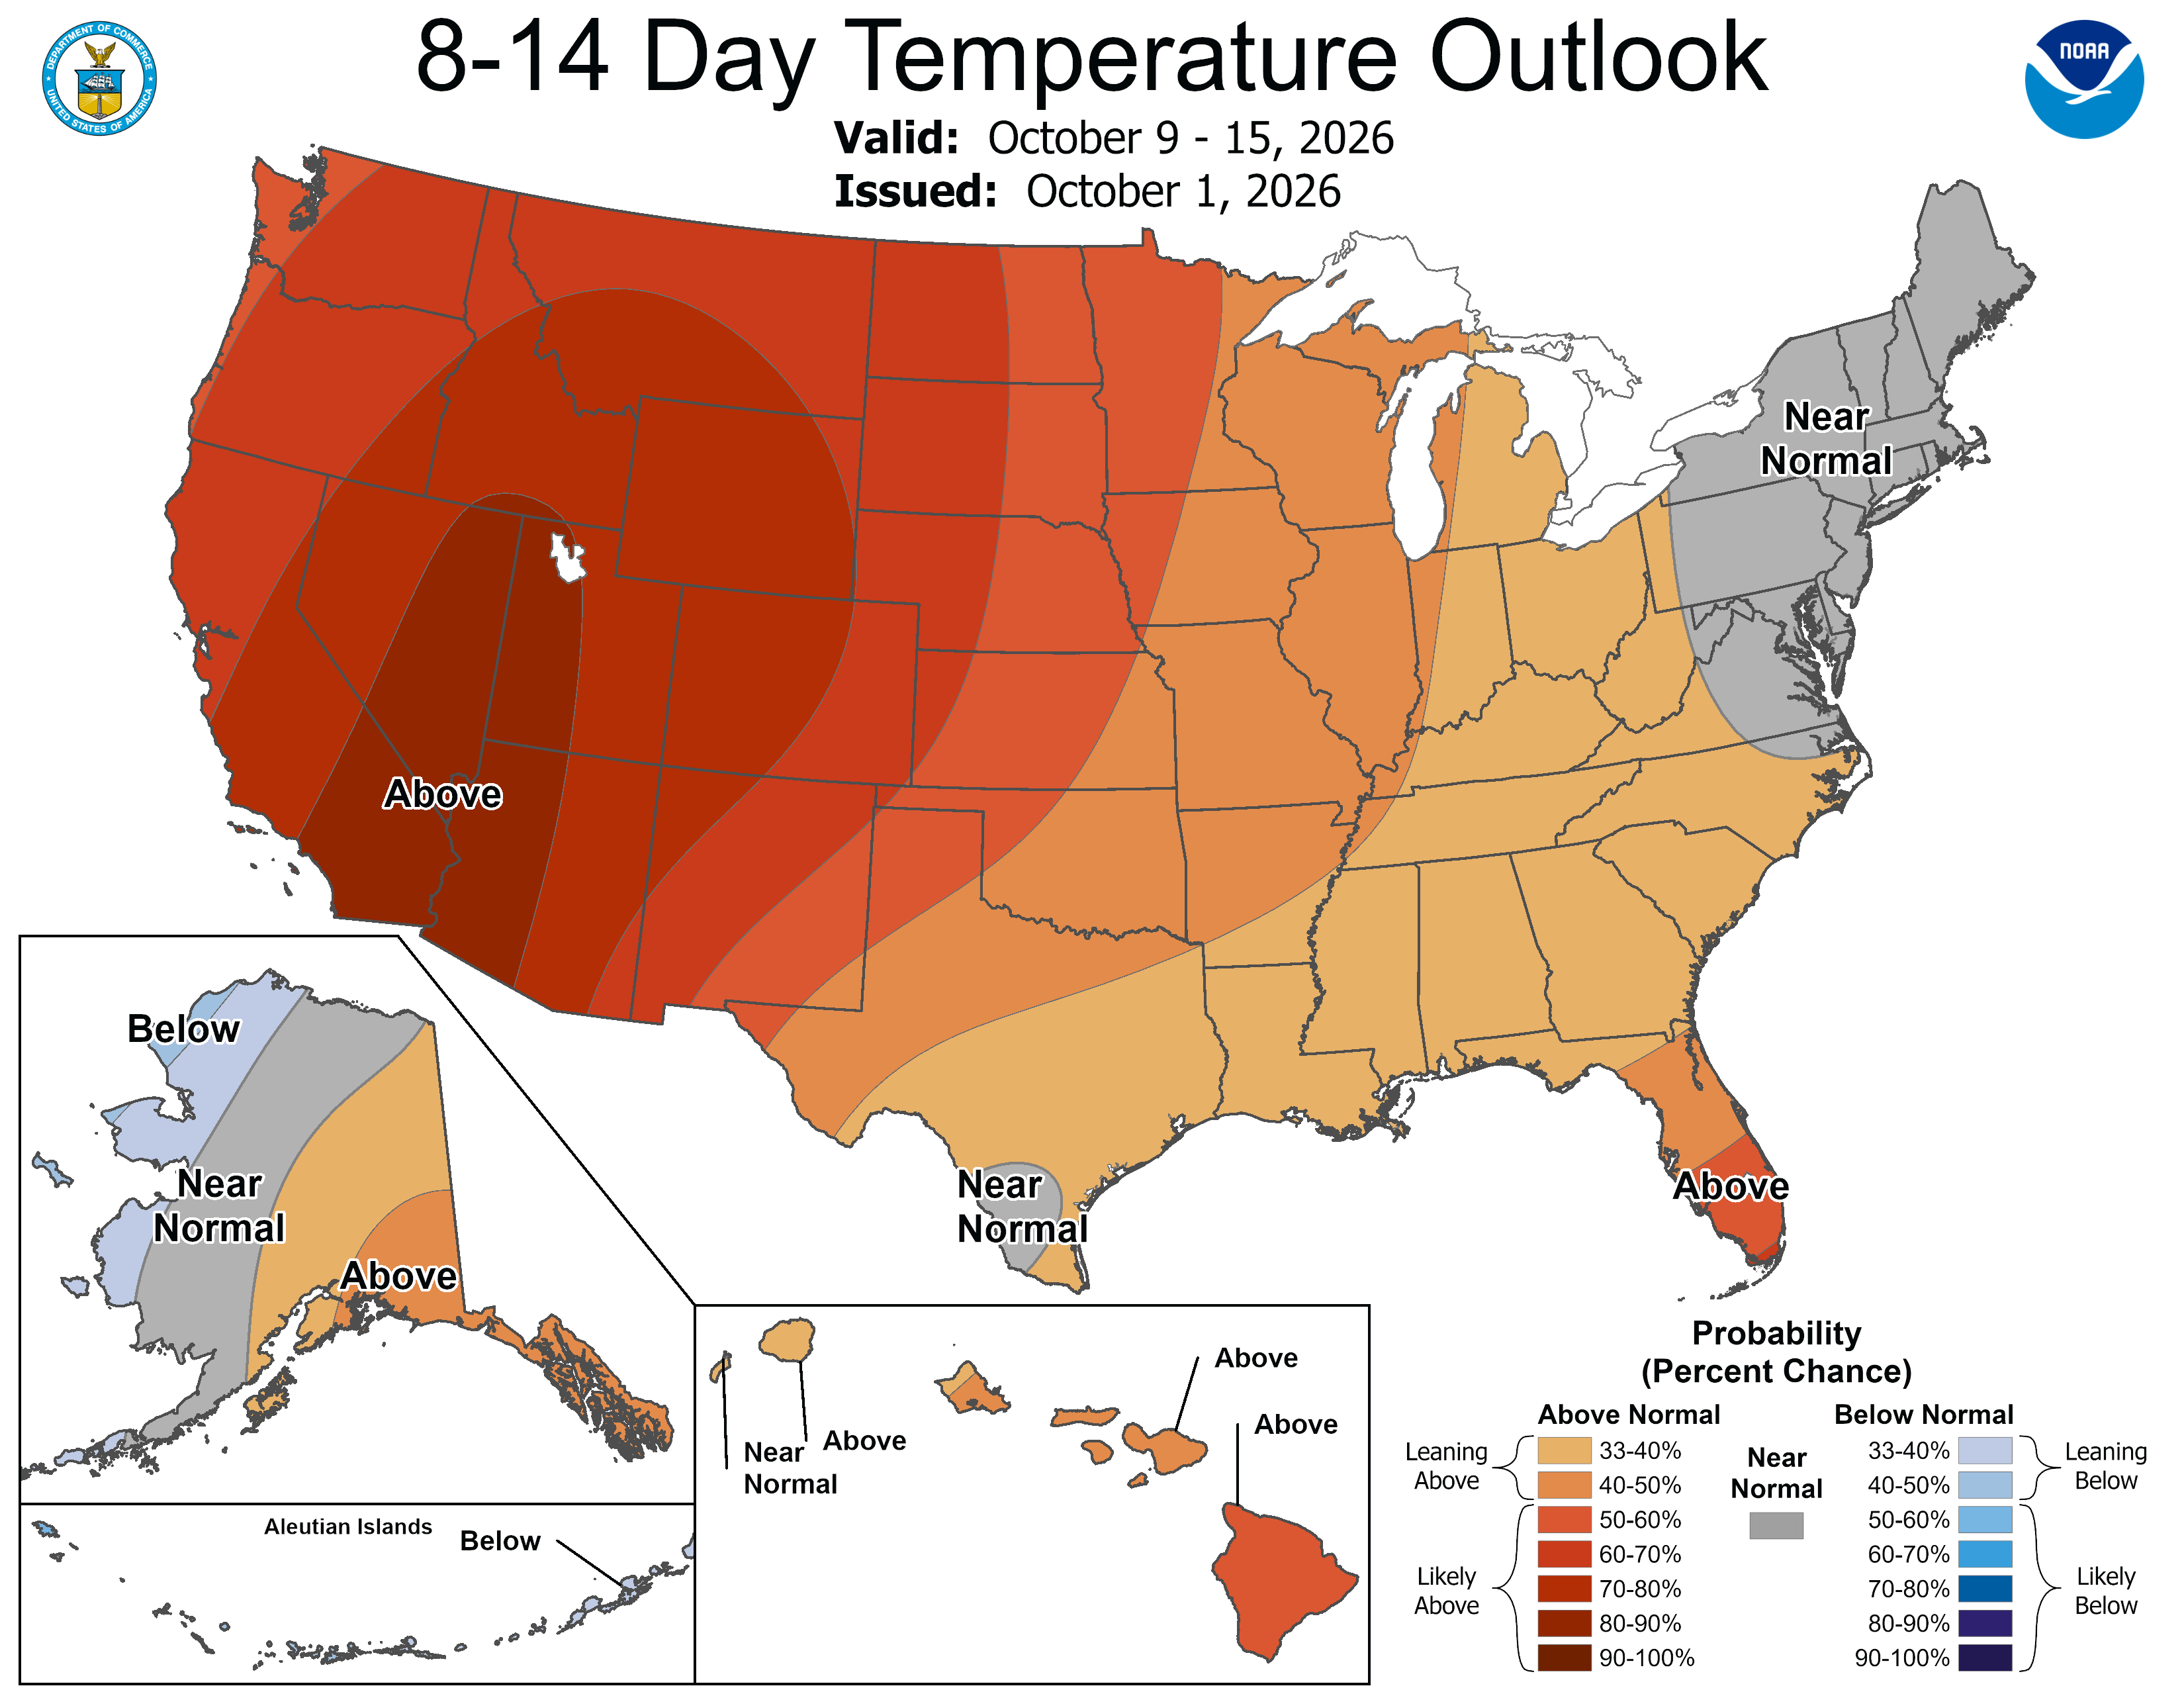 8-14 day temperature outlook
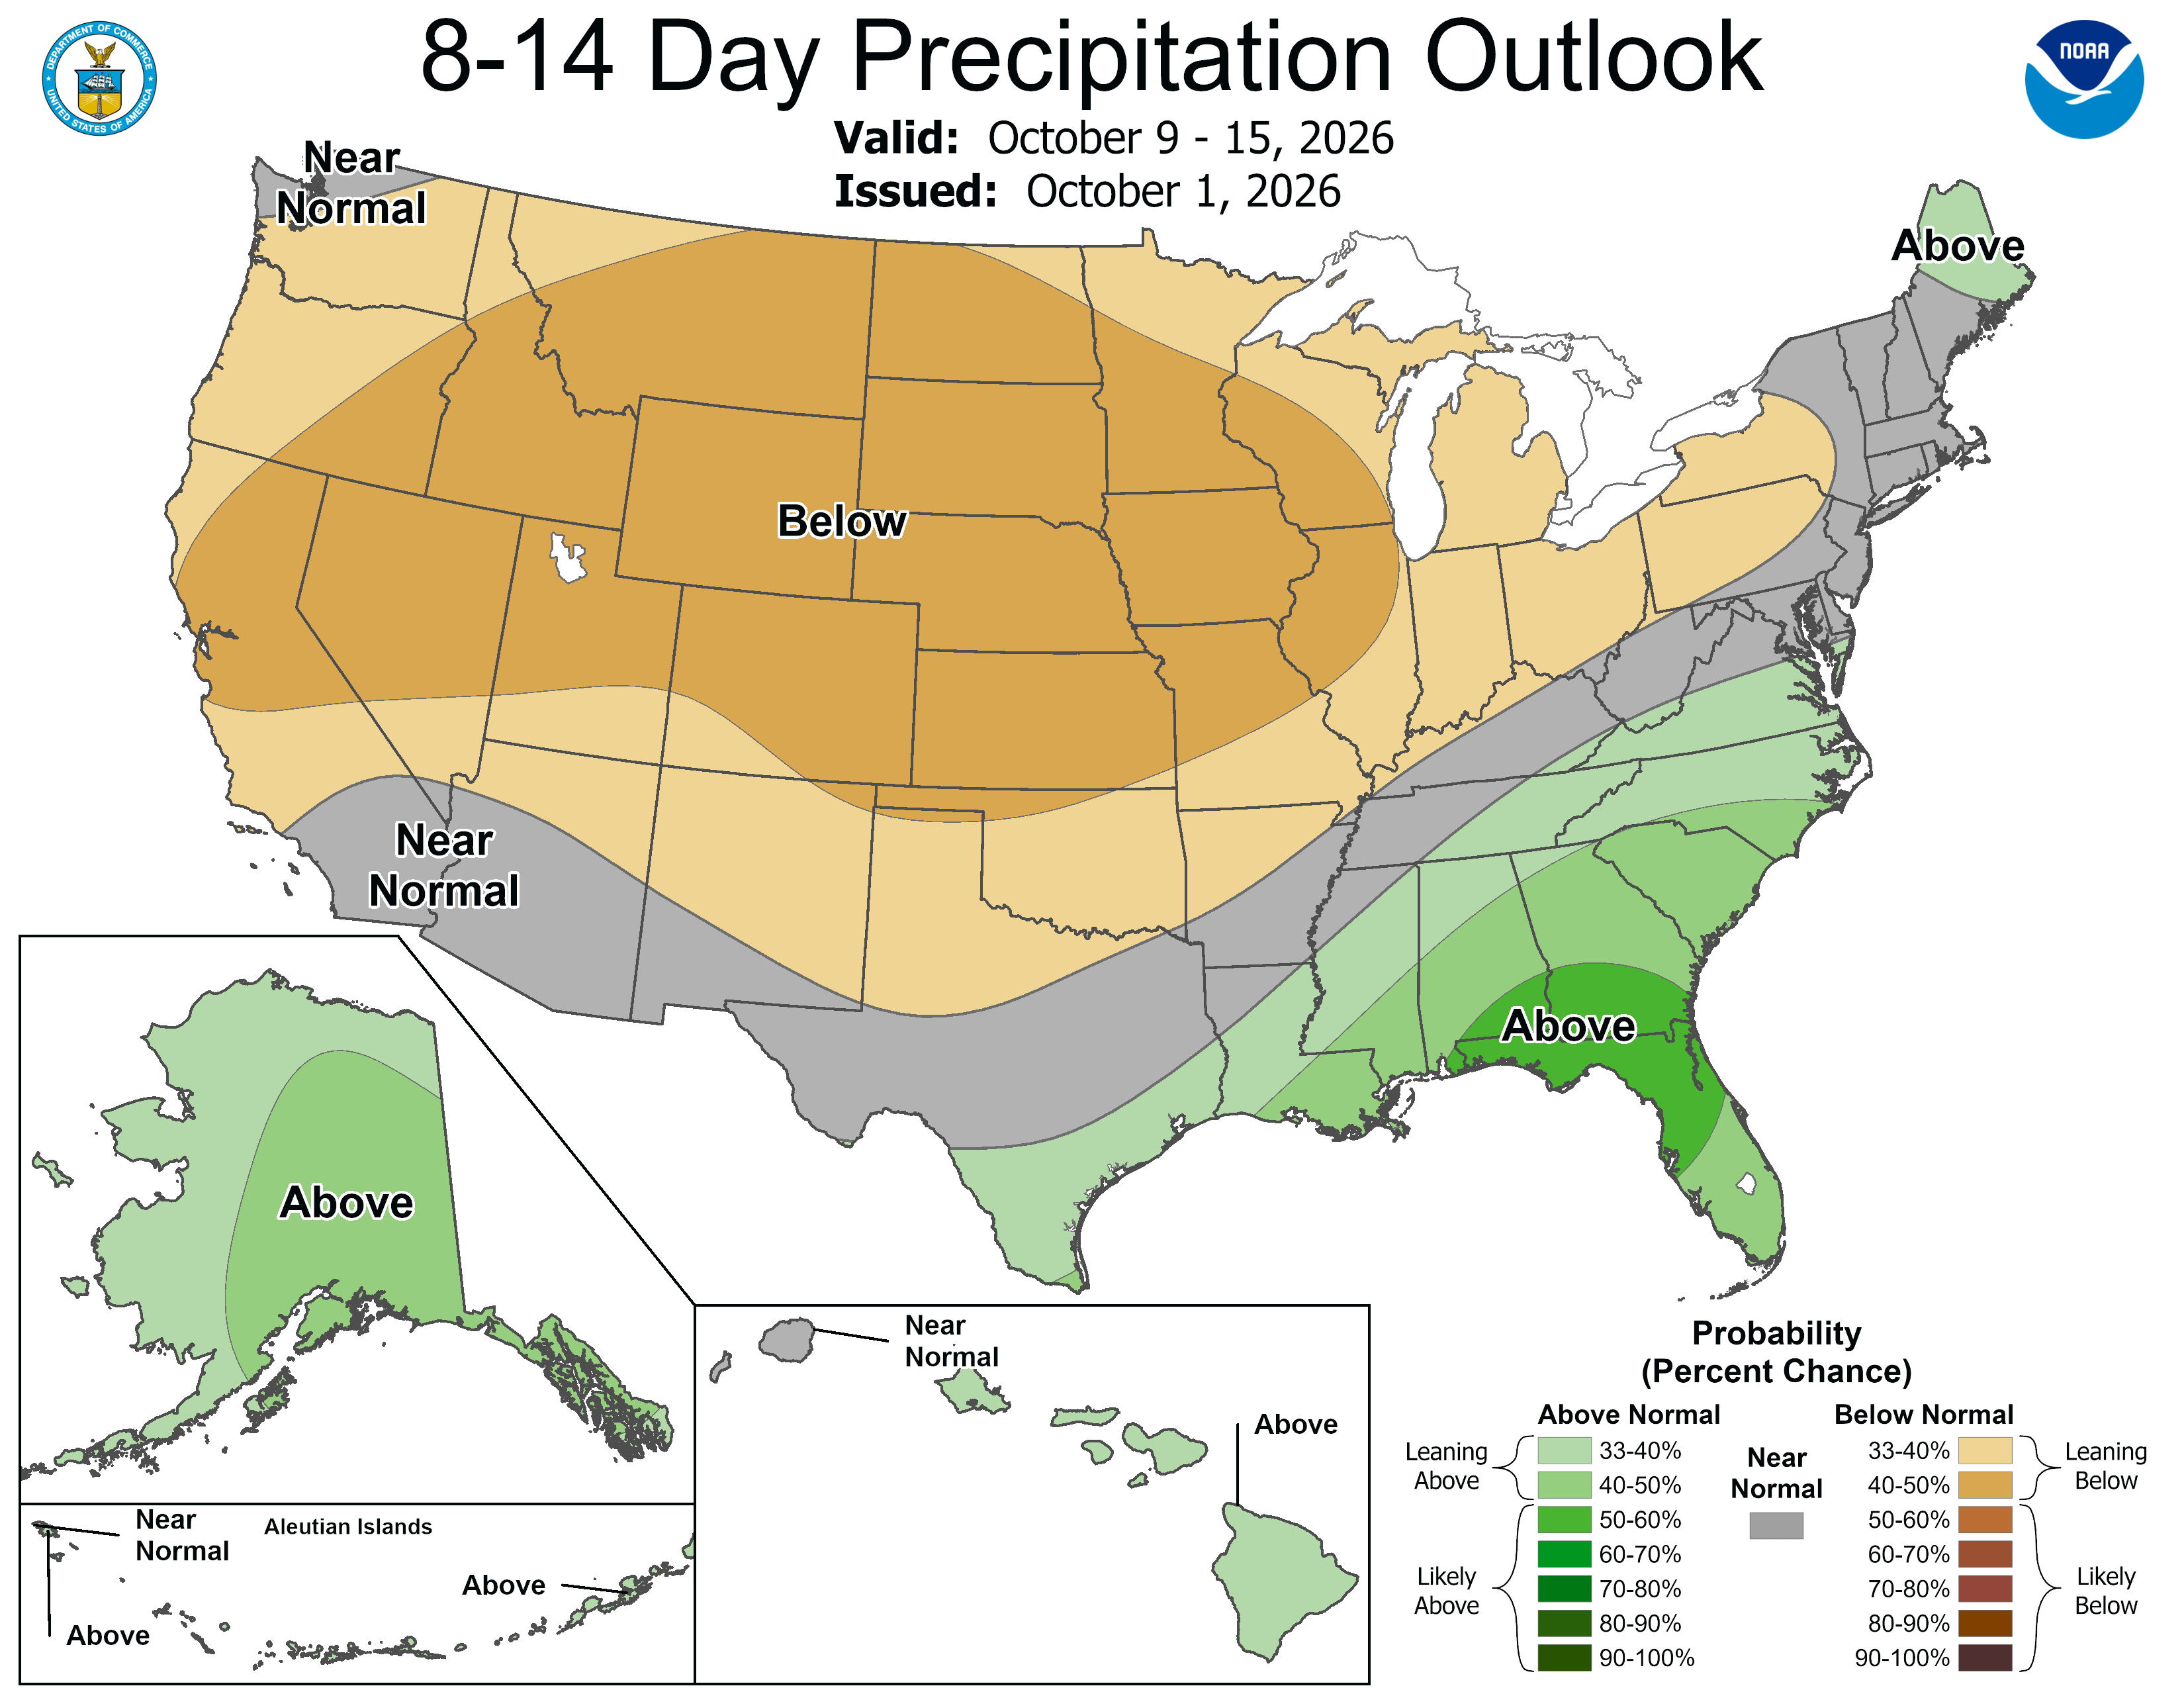 8-14 day precipitation outlook
🗄️ Winter storm desk - closings & power outages
Signals as of Fri Oct 02, 05:52 PM ET - Signals come from active National Weather Service alerts (the same trigger superintendents watch); final calls are made by each district, usually 5:30-7:00 am.
No closure-relevant NWS alerts in East Tennessee right now - a quiet board. When winter alerts fire, each county lights up here automatically.
School districts (47) - tap for each district's own call
| District | County | Check status |
|---|---|---|
| Anderson County Schools | Anderson | closings |
| Oak Ridge Schools | Anderson | site · closings |
| Bledsoe County Schools | Bledsoe | closings |
| Blount County Schools | Blount | closings |
| Maryville City Schools | Blount | site · closings |
| Alcoa City Schools | Blount | site · closings |
| Bradley County Schools | Bradley | site · closings |
| Cleveland City Schools | Bradley | site · closings |
| Campbell County Schools | Campbell | closings |
| Carter County Schools | Carter | closings |
| Elizabethton City Schools | Carter | site · closings |
| Claiborne County Schools | Claiborne | closings |
| Cocke County Schools | Cocke | closings |
| Newport Grammar (city) | Cocke | closings |
| Cumberland County Schools | Cumberland | site · closings |
| Fentress County Schools | Fentress | closings |
| Grainger County Schools | Grainger | closings |
| Greene County Schools | Greene | closings |
| Greeneville City Schools | Greene | site · closings |
| Hamblen County Schools | Hamblen | closings |
| Morristown-Hamblen (city) | Hamblen | closings |
| Hamilton County Schools | Hamilton | site · closings |
| Hancock County Schools | Hancock | closings |
| Hawkins County Schools | Hawkins | closings |
| Kingsport City Schools | Hawkins | site · closings |
| Jefferson County Schools | Jefferson | site · closings |
| Knox County Schools | Knox | site · closings |
| Loudon County Schools | Loudon | closings |
| Lenoir City Schools | Loudon | closings |
| Marion County Schools | Marion | closings |
| McMinn County Schools | McMinn | closings |
| Athens City Schools | McMinn | closings |
| Meigs County Schools | Meigs | closings |
| Monroe County Schools | Monroe | closings |
| Morgan County Schools | Morgan | closings |
| Polk County Schools | Polk | closings |
| Rhea County Schools | Rhea | closings |
| Roane County Schools | Roane | closings |
| Scott County Schools | Scott | closings |
| Sequatchie County Schools | Sequatchie | closings |
| Sevier County Schools | Sevier | site · closings |
| Sullivan County Schools | Sullivan | closings |
| Bristol TN City Schools | Sullivan | closings |
| Unicoi County Schools | Unicoi | closings |
| Union County Schools | Union | closings |
| Washington County Schools | Washington | closings |
| Johnson City Schools | Washington | site · closings |
Power & utilities (14) - live outage maps + report numbers
| Utility | Primary area | Outage info |
|---|---|---|
| KUB - Knoxville Utilities Board | Knox and parts of Anderson, Blount, Sevier, Union | site · outage map |
| EPB Chattanooga | Hamilton (Chattanooga) | site · outage map |
| Sevier County Electric System | Sevier | outage map |
| Greeneville Light & Power | Greene | outage map |
| Johnson City Power Board (JCPB) | Washington, Unicoi, Carter, Greene (parts) | site · outage map |
| Bristol Tennessee Essential Services | Sullivan (Bristol) | site · outage map |
| Appalachian Power (AEP) | Sullivan, Hawkins, Washington (parts) | site · outage map |
| Fort Loudoun Electric Co-op | Loudon, Monroe, Blount, McMinn (parts) | outage map |
| Volunteer Energy Cooperative | Rhea, Meigs, Hamilton (north), McMinn, Bradley (parts) | site · outage map |
| Sequachee Valley Electric Co-op | Marion, Sequatchie, Bledsoe | outage map |
| Plateau Electric Co-op | Cumberland (plateau), Morgan, Scott (parts) | outage map |
| Athens Utilities Board | McMinn (Athens) | outage map |
| Newport Utilities | Cocke (Newport) | outage map |
| TVA | Regional grid coordination | site · outage map |